 |
Department of Physics | AstroLab |
Supernovae Monitoring and Discovery
Supernovae result from the explosive end of a massive star or a white dwarf star. A supernova can, for weeks, emit more light than their parent galaxy and radiate more energy than the Sun will in its entire lifetime. They are also the primary source of heavy elements in the universe. Each year hundreds of supernovae are discovered. Nearby supernovae are sufficiently bright that they can be observed with our Durham telescopes and the La Palma pt5m, and their light curves constructed.
The aim of the project is both to determine the light curves of recently discovered supernovae and to make observations of a nearby rich galaxy cluster in order to discover new supernovae. As, on average, supernovae only occur about once every 50 years in a galaxy the size of the Milky Way, the chance of finding a new SN are very very small. However the observations of the cluster field will allow an upper limit of the supernova rate in the dense cluster environment to be determined.
SN2014J
On 2014 January 21 a new supernova (SN2014J) was discovered by Steve Fossey (UCL) in M82 - a very nearby (~3.8 Mpc) star-forming galaxy. This SN was monitored in three photometric bands (B, V, r) using the AstroLab telescopes. Our first observation was made on 2014 January 23 (see image below) and the last observation was made on 2014 May 21.
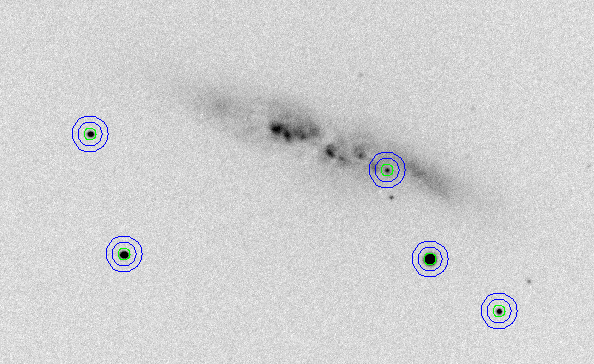
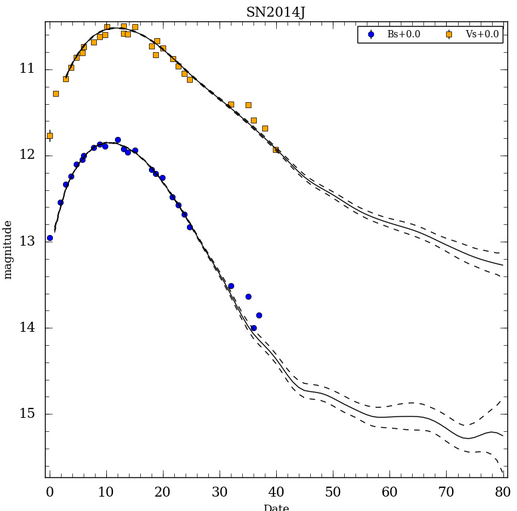
The B and V-band light curves for SN2014J (shown below) were constructed from the Durham data by Vicky H. and Jack B.
SN2015M
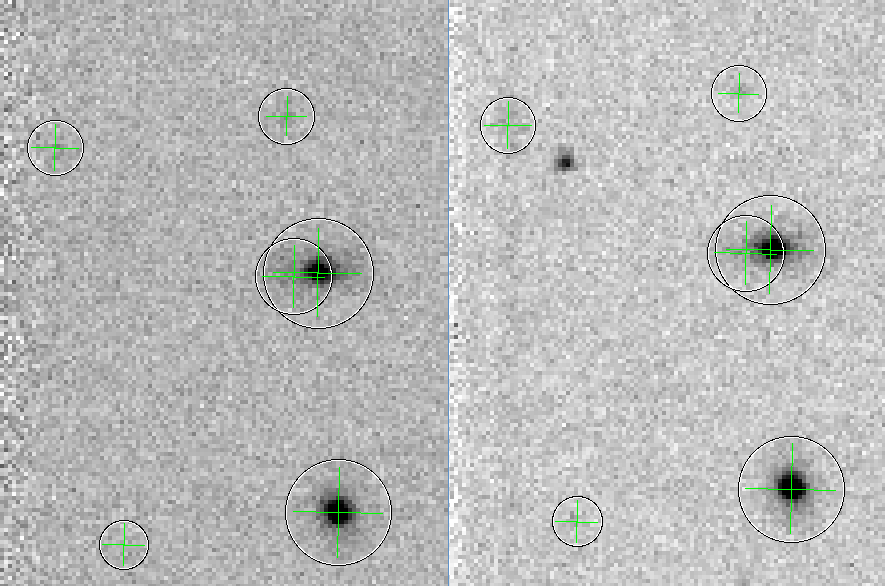
The supernova 2015M was independently discovered using the Durham telescopes. The image below shows the Durham discovery image of this hostless supernova in the Coma cluster (D = 100 Mpc). The overlayed symbols denote previously catalogued galaxies in the Coma cluster.
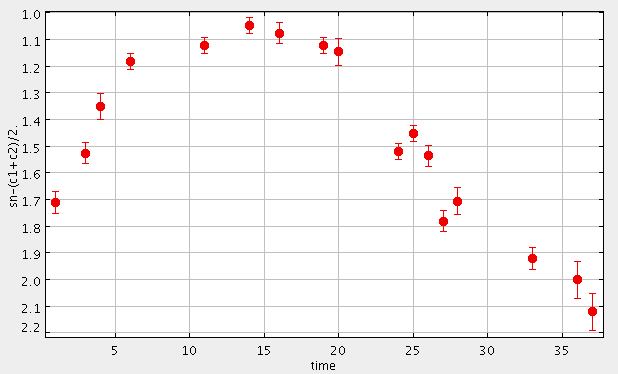
Below is the V-band light curve (relative to two comparison stars) for 2015M derived from the Durham telescopes spanning the period from 2015 May 12 to June 18.
SN2015as
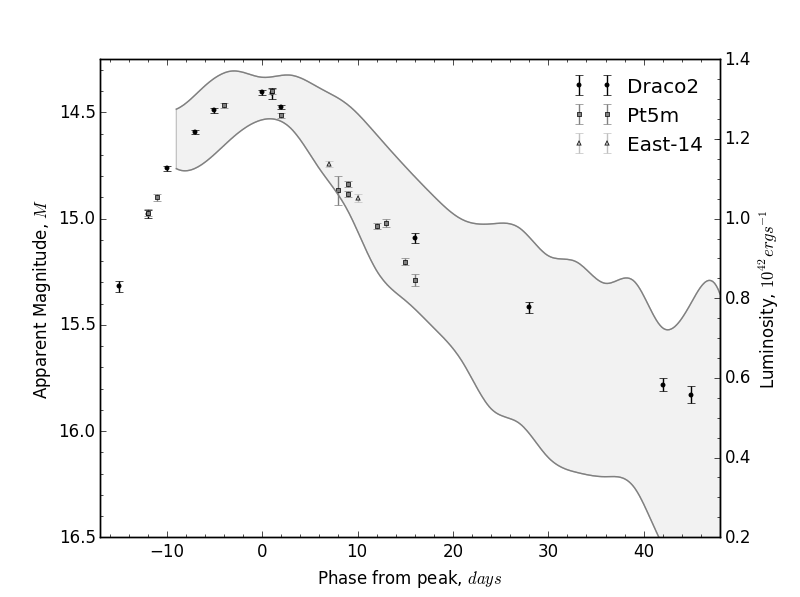
In the 2015 Michaelmas term the supernova 2015as in the nearby (D = 20 Mpc) spiral galaxy UGC5460 was observed by Astrolab students (Ugne and Joy). The light curve measured is shown below. The shaded area represents a range of magnitudes that a Type IIP supernova can take.
 Project Notes
Project References
| Back to the AstroLab Home Page | jrl | 2020-Jun-17 12:46:40 UTC |